Public Transit Accessibility & Disability Dashboard
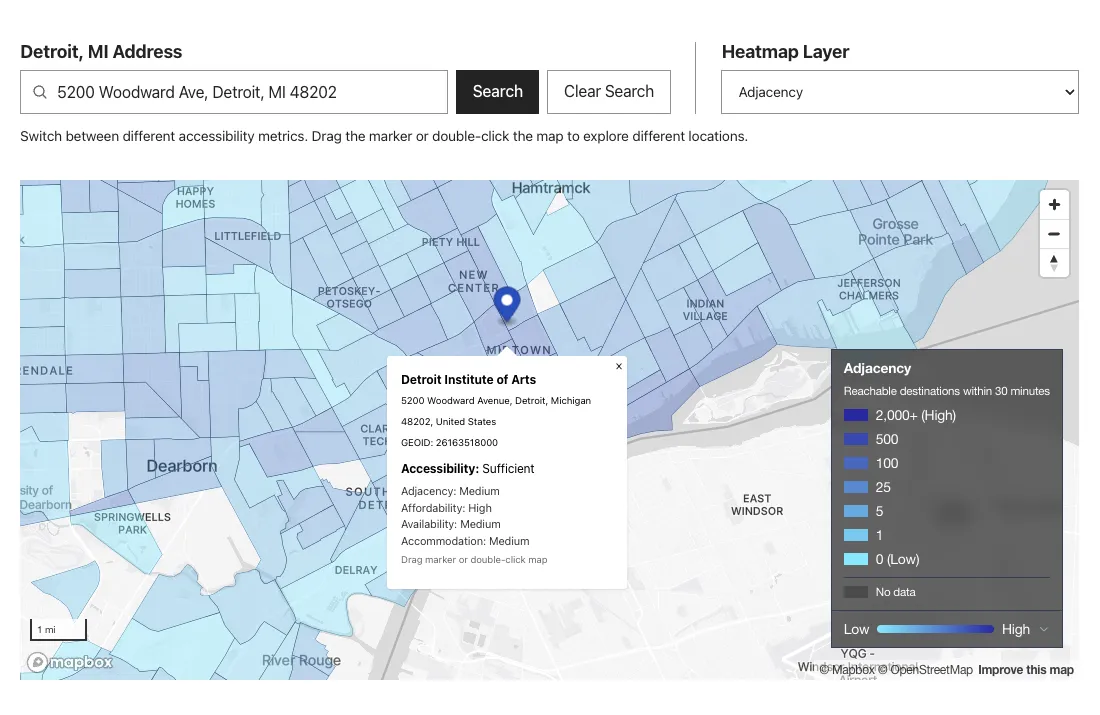
A public dashboard from the University of Michigan's Center for Inclusive Mobility Environments that scores transit accessibility for people with disabilities across 85 U.S. cities and 99 transit systems.
The problem
Whether a place has accessible public transit can't be answered with 'is there a stop nearby.' It depends on how well a system accommodates disabled riders, how many destinations a rider can reach, how often service runs, and what it costs. That data existed, scattered across NTD records, Census demographics, and per-agency scores, but nothing tied it together in a form a person could look up and compare.
The research team also wanted the site shaped by the people it's for. A five-person advisory board of disabled transit riders and advocates gave feedback throughout, and it drove real design decisions. Advisors asked for overlapping transit systems in the analysis, a city comparison tool, and guides written for specific audiences.
Architecture
Astro runs in hybrid mode. Static pages carry the content, and server routes on Cloudflare Workers handle the address lookup. Sanity manages the pages, navigation, and site settings (including the tooltips on city pages), so the research team can change wording without a deploy.
A lookup starts with Mapbox geocoding, then a Tilequery against the Census tract tileset returns the 11-digit tract GEOID. If Mapbox is unavailable, the Census geocoder takes over and the block GEOID is trimmed to a tract, so the tool degrades instead of breaking. Coverage is checked against bounding boxes in code (regions.ts), not in the database, so adding or adjusting a city doesn't need a migration.
Cloudflare D1 holds the scores: tract-by-system, system, and city tables, plus ACS tract demographics and accommodation summaries, joined into a single API response. The heatmap layers on the city pages are Mapbox GL over the same tract tileset, so the map and the lookup always agree on what a tract is.
The home page asks for a state and city instead of offering an open search box. That came from advisory board feedback: an open box invites addresses the data doesn't cover, so visitors are guided to places that have data, and address lookup lives on each city page.
python3 scripts/import-2025-data.py   # research team's CSVs in, SQL out. The database isn't touched yet
npx wrangler d1 execute transit-accessibility-db --local --file=database/migrations/2025/import-city-scores.sql
npm run dev:wrangler                  # spot-check real addresses against the local D1
npx wrangler d1 execute transit-accessibility-db --remote --file=database/migrations/2025/import-city-scores.sql
npm run seed:rankings                 # sync top cities and systems into Sanity
Two things I had to get right
The project started as a Detroit prototype scored at the census-block level, grew to five regions, and ended up as tract-level scores for 85 cities, so the data model changed along with the numbers. I made the update a repeatable path so each handoff was routine. A script converts the research team's CSVs into SQL without touching the database and prints every city and row count for review. The same files then go into a local database, get spot-checked in the browser, and only then go to production.
Agency names and links live in their own CSV, so a scores-only update never touches them, and the map tileset is only rebuilt if Census tract boundaries change. The update process, the CMS, and the data are all documented, including a training manual and a NotebookLM notebook for the research team.
Because the tool is about transit accessibility for people with disabilities, the dashboard had to work for the people it serves. Playwright runs axe-based accessibility tests and a separate map accessibility spec, and pa11y-ci checks key pages. The lookup form announces status and errors through ARIA live regions. The map has a descriptive label, a skip link, and keyboard controls for moving the marker, and the scores also appear as text for anyone who can't use the map.
Automated testing only goes so far and we needed people with disabilities to check the site. So we had the University's accessibility team review the site, and I've been working through their findings. The hardest are on the map, since Mapbox GL doesn't offer keyboard panning out of the box.
Impact
The dashboard is federally funded through the National Institute on Aging and National Cancer Institute, and it's already used by the audience it was built for. Disability advocates use it to make their case to local leaders. Kaci Pellar, Policy Manager at Detroit Disability Power, said it "gives advocates the data to show local leaders where we stand." The site has separate guides for four audiences (community advocates, researchers, transit agencies, and policymakers) so no one has to wade through a dashboard built for someone else.
- Live for 85 U.S. cities and 99 transit systems, scored at the tract, agency, and city level
- Mapbox geocoding with Census fallback
- Repeatable data refresh, from the research team's CSVs to production
- Axe and pa11y-ci tests, plus a dedicated map accessibility spec
- Federally funded (NIA/NCI), in active use by disability advocacy organizations